Preface
Before diving further into how to decipher extraterrestrial languages, we need to take a step back and make sure we have a solid understanding of the main tool we have at our disposal for arriving at a solution.
And though the title of these articles gives things away a bit, the connection between this problem and graph data structures isn’t immediately obvious. However these data structures have a broad range of applications in the real world, and mastering them is going to be the key to cracking this problem, and similar ones during technical interviews.
The reason for taking the scenic route towards a solution is to help you develop a deeper understanding of the core concepts this problem leverages, rather than just helping you memorize one particular approach. The goal here, as always, is to be able to see all problems like this as just variations of a larger pattern that shows up again and again in interviews.
And if I’m lucky, you’ll also walk away with a greater appreciation for the elegance and beauty behind graphs, both conceptually and in the real world.
So with that said, let’s jump in.
What are Graphs?
The simplest description of a graph is just that it’s a collection of relationships between things.
Which I want to acknowledge isn’t a very helpful definition on its own, but I do think most of us have some intuition about them.
They’re more commonly called networks or webs, and they appear in a lot of real-world physical structures like the brain, road systems, spider webs (duh), underground fungal mycelium networks, molecular bonds, or galactic supercluster filaments. But they can also be used more abstractly to model things energy flows in ecosystems, flight routes between airports, trade between countries, or links between sites on the internet.
They have two basic components: nodes and edges.
The nodes, also called vertices, represent the collection of things, and the edges are the relationships between those things.
Both nodes and edges contain some information within them about the things or relationships they are modeling.
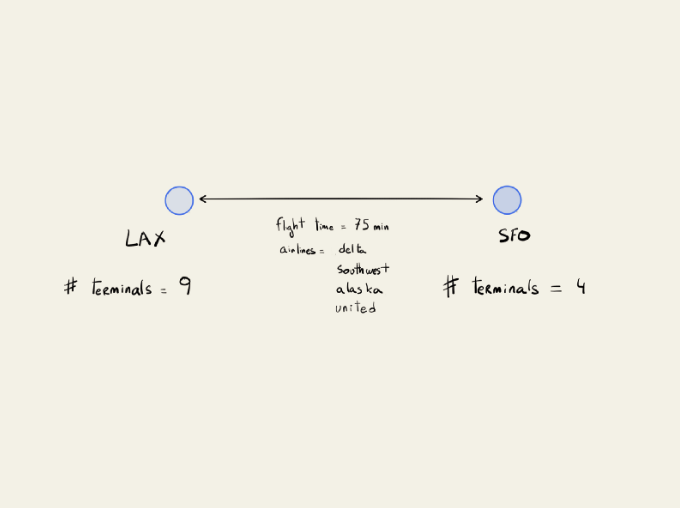
So using the airport hub example, each airport would be represented by a node that contained the airport name, the three-letter code, the number of terminals and gates, and the list of airlines that it services.
The routes available between different airports would be the edges, and those would have some information about which airlines fly that route, the time/distance between those airports, and what times those flights run.
There are a ton of real-world business and software engineering applications for graphs, with everything from databases, to server architecture, to UI/UX design, to data modeling.
What Are User Flows In User Experience (UX) Design?
They are so prevalent that most people don’t tend to think about the fact that all social networks and the internet itself are built on top of the idea of graphs.
Which shouldn’t be surprising.
To paraphrase the late Steve Jobs:
“Great technology is invisible.”
What are the properties of Graphs?
In the context of graphs as data structures, they exist at the top of the hierarchy, where most other data structures exist as some more constrained version of them.
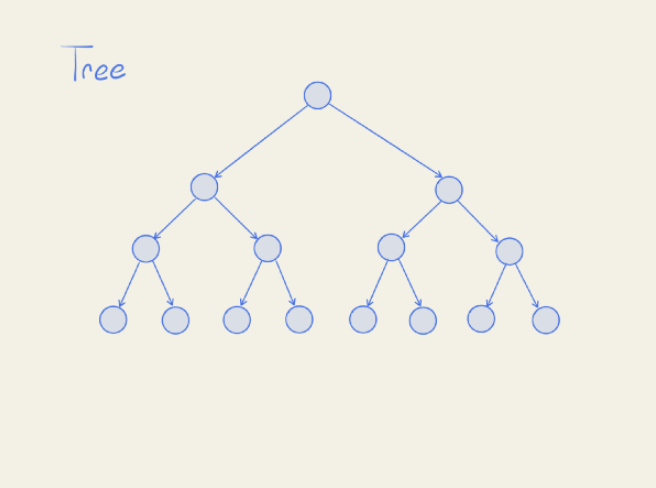
For example, a linked list is just a graph that can only have one connection between nodes. A binary tree is a graph that can only have two connections. And an n-ary tree, like a trie, is just a graph that can’t contain cycles.
This makes them both highly flexible in what they can be used for, but also more complicated to learn because constraints tend to simplify things. They allow you to ignore more potential edge cases that can arise in general graphs.
This is also why I think it makes sense to learn graphs after learning the others because they require some more considerations when performing the usual operations associated with building and traversing them.
Graphs themselves come in a variety of different flavors, which again hinge upon relaxing or tightening certain constraints.
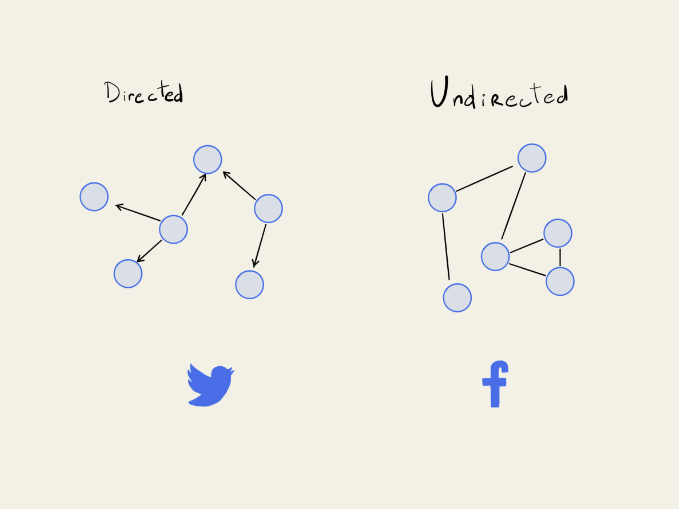
Let’s start by looking at one of the more basic kinds, which are unweighted, and undirected. An example of this would be friendships on Facebook.
These model symmetrical relationships, meaning if you are my friend, then I am necessarily your friend.
And they also have no distinctions between different relationships. Meaning there is no additional qualitative information between Alice and Bob’s friendship than there is between Alice and Charlie’s friendship.
The next, broader variety are unweighted and directed graphs. Some examples of this kind of graph are followers on Twitter or Instagram.
I don’t necessarily need to follow you, in order for you to follow me.
This allows you to end up with situations where a few people have millions of followers and then most people who have a few hundred or a few thousand followers. There are some interesting real-world implications to having this dynamic.
Just to name one example, it means that the architecture of your systems have to handle posts differently, depending on the number of followers that someone has because of the difference in relative volume. This is because it takes far fewer system resources and design considerations to handle a post going out to a few hundred people and then handling all the responses than it does to handle a post potentially going out to millions of followers.
And as a heads up, this is the type of question that is commonly asked on system design interviews.
And then the last kind I’ll cover here are weighted, directed graphs.
These are graphs where the relationships between nodes have some kind of quality to them. Using the airport example, this would be the distance between two hubs.
You’ll see the idea of weights pop up quite a bit in things like machine learning, where neural networks use weights between nodes to perform computations and make decisions.
And there is even an element of weighting between friendships/followers on social networks themself, though it isn’t captured in the relationship itself.
The way to think about this is in the frequency in which you are shown different friend’s posts.
If you Alice and Charlie send each other messages every day, and constantly like and comment on each other’s posts, then there is an implicit understanding that they are more closely connected than Alice and Bob, who may not interact much at all. Though everyone is still friends, Alice and Charlie’s posts will pop up more frequently in each other’s feeds, because the algorithm is prioritizing their posts more highly to each other. This is an implicit weight between two nodes, though that information does have to actually tangibly live somewhere.
And this is all with the goal of trying to maximize the time a user spends on the site.
This kind of weighting is powerful and has a variety of uses. If the goal of the company is to maximize profits, and the algorithm achieves this by maximizing the amount of time people spend on the site, which in turn maximizes the likelihood of them seeing ads.
Hopefully, you can see the positive feedback loop at work here.
The more posts you see that you like, the more you stay on the site interacting, the more those weights between connections get reinforced, and the more likely you are to see posts you are likely to interact with.
There are other types of graphs with tighter or looser constraints, like negative weights, or a maximum number of edges between nodes (grids), or multiple kinds of weights per edge, or allowing for multiple connections between the same nodes. I consider these to be a little too deep down the rabbit hole for the purposes of this series, but it’s worth knowing that they are there and they all have their own quirks and nuances.
But there is one more property of graphs that I want to touch on before moving on because it provides an important constraint and allows us to categorize graphs in important ways.
This has to do with if a graph contains a cycle or not.
An idea that is central to graphs is that you can “travel” from one node to another along any edges they are connected by. This is like being able to take a flight between two airports.
This travel has directionality, in the same way, that whenever you fly you have two airports, with one being the origin and the other being the destination.
Now usually when you are able to fly directly from one airport to another, you are able to take a flight back, but with graphs, this isn’t necessarily the case.
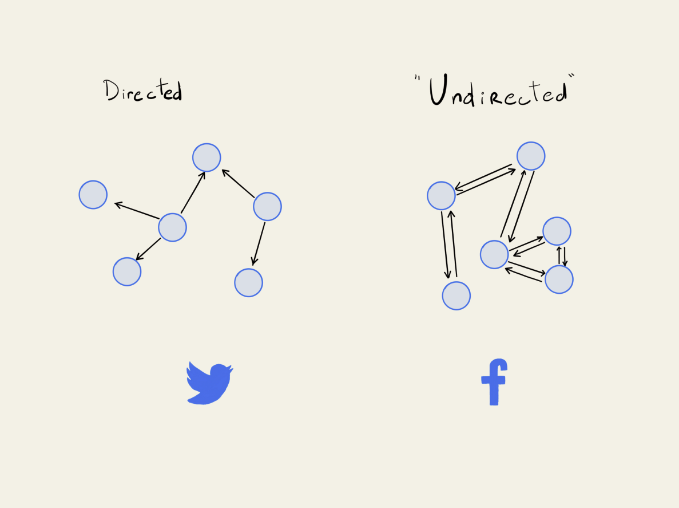
This makes a little more sense in the context of directed graphs than in undirected ones because all undirected graphs can be represented as directed graphs in a relatively simple way.
Whenever you want to make a directional connection between node A to node B, you just have to make it from node B to node A too.
And in fact, this is a common implementation for undirected graphs: just use a directed class, but modify it slightly so any time you make one connection, you also make the reciprocal one.
However, this creates the problem that you are always creating cycles between nodes since you always have a connection back to where you came from. A simple way around this is just to say that cycles only count if they have more than two nodes in them.
But for our purposes, we care about whether we are looking at directed, acyclic graphs, usually abbreviated just as DAG.
So for example, a binary tree would be a special case of a DAG because there is no way to end back up where you started after traversing from one node to another.
So all binary trees, and all trees in general, are DAGs. But not necessarily all DAGs are trees.
One thing that special about all trees is that there is always a unique path to every node. There are never two ways to arrive at the same node.
This isn’t necessarily the case with all DAGs, and here’s an example:
Because of this lack of cycles, you can establish an ordering to these nodes that somewhat mimics the idea of a root node and leaf nodes in trees. There are certain nodes that are at the “top” and others that are at the “bottom.”
You can think about this as like an ordering algorithm for putting the nodes into a list that boils down to this one idea:
“A node can only go in the list when all nodes above it are in the list.”
So running through a quick example, try to come up with the ordering for this graph:
Now depending on how your mind works, you might get one of several possible lists, all of which are valid. It all depends on where you chose to start and how you added your nodes to the list.
Because that description of the algorithm doesn’t enforce a strong enough constraint to guarantee a particular ordering.
But it turns out this ordering algorithm is going to be key for solving the problem of the alien dictionary. Hopefully labeling the nodes with letters didn’t make it too obvious.
But before we can need to figure out two things first:
How to model the problem as a graph problem.
How to traverse that graph so we get the ordering we want.
And for that, we’ll need to talk a little bit about how to actually implement different kinds of graphs and discuss some of the benefits and tradeoffs of each implementation.
Conclusion
The key takeaway I want you to have from all the is that solving problems really comes down to finding the right tool for the job and being able to think flexibly in terms of those tools. I’m personally a very visual learner, but find the right framework that meshes with your way of thinking.
There’s a difference between solving the problem at a conceptual level, and actually implementing a solution in code. I think that’s one of the biggest paradigm shifts that happen to coders as they start getting better at algorithm problems. You need to be able to solve them in your head first using the correct mental model. Then you have to be able to make the right conceptual connections to actually implement that solution in code.
Because there always have been and always will be layers of abstraction between our human way of thinking and how computers execute instructions to solve problems that we care about. It’s just part of the game of being a software engineer.
And graphs are some of the most powerful abstractions you can master.
